
The report includes state-specific measures of lung cancer incidence, adult smoking prevalence, estimated percent of radon tests at or above the U.S. EPA action level, five-year survival, early diagnosis, surgery as part of the first course of treatment, lack of treatment, and screening among those at high risk.
Lung cancer incidence, staging, surgical treatment, and lack of treatment data is for years 2017-2021 and includes malignant lung and bronchus tumors. These data are based on the North American Association of Central Cancer Registries (NAACCR) December 2023 data submission. In the U.S., registries also participate in the National Cancer Institute's Surveillance, Epidemiology, and End Results (SEER) Program or the Centers for Disease Control and Prevention's (CDC) National Program of Cancer Registries (NPCR) or both. Support for cancer registries is provided by the state, province or territory in which the registry is located.
Incidence data for Arkansas are for 2017-2021 from CDC’s WONDER Online Database United States Cancer Statistics as data from this state for 2021 and 2022 were not included in the NAACCR data submission. Data for Indiana are for 2018-2021 as 2022 was not available.
Trend data reflect the percent change between the most recent year of data and those five years earlier if the change was statistically significant at the .05 level. If the change was not statistically significant, the trend was labeled as “flat.”
Cases diagnosed at an early stage correspond with local stage from SEER summary staging and are equivalent to stage I. Cases diagnosed at a late stage correspond with distant stage from SEER summary staging and are equivalent to stage IV.
State survival rates are the age-standardized percent of cases still alive five years after diagnosis for cases diagnosed in years 2015-2021. These data are from NAACCR’s CiNA Explorer, an interactive, data visualization tool for quick access to key NAACCR CiNA cancer statistics. Survival data was not available for 11 states and the District of Columbia.
Lack of treatment is the percent of lung cancer diagnoses that did not receive any medical treatment generally associated with lung or other cancers, including the following: removal, biopsy or aspiration of regional lymph node; surgical removal of distant lymph nodes or other tissue(s)/organ(s) beyond the primary site; surgery for lung cancer; radiation; chemotherapy; systemic hormonal agents; immunotherapy; other, including experimental, double-blind, and unproven; and transplant or endocrine surgery or radiation. Rates from this year should not be compared to those from reports prior to 2024 due to a change in variables.
Screening rates were determined by dividing the number of self-reported lung cancer screening exams meeting United States Preventative Task Force (USPSTF) criteria by the number of people at high risk for lung cancer and recommended for annual screening with low dose computed tomography using data from the Centers for Disease Control and Prevention’s 2022 Behavioral Risk Factor Surveillance System (BRFSS). Screening rates in this year’s report have been updated to correct an error in the data source and should not be compared to previous reports.
Smoking rates are the percent of adults who have ever smoked 100 or more cigarettes and currently smoke on some days or all days using data from the 2023 BRFSS.
Additional years of life gained and economic benefit of screening comes from Philipson TJ, Durie T, Cong Z, Fendrick AM. The aggregate value of cancer screenings in the United States: full potential value and value considering adherence. BMC Health Services Research. 2023; doi.org/10.1186/s12913-023-09738-4.
To assess states’ current requirements for insurance coverage of comprehensive biomarker testing, the Lung Association surveyed state legislation mandating coverage of testing. States with laws requiring coverage of comprehensive biomarker testing ensure that individuals with lung cancer and other diseases have access to lifesaving testing when using both public or private health coverage. A smaller handful of states have thus far limited coverage of biomarker testing to only public or only private plans or limited to specific diseases (Nebraska). Results are current as of August 2025.
Smoking rates include the percent of adults who have ever smoked 100 or more cigarettes and currently smoke on some days or all days using data from the 2023 BRFSS.
Radon estimates for each state are primarily based on the most recent ten-year period’s proportion of county-level pre-mitigation radon tests from occupied interior spaces at or above the U.S. Environmental Protection Agency action level of 4 pCi/L (picoCuries per liter of air) from CDC’s National Environmental Public Health Tracking for 2008-2017, limited to counties with at least ten results, weighting those fractions by U.S. Census Bureau 2019 estimates of county populations.
Hawaii radon estimates are based on “EPA's Map of Radon Zones: HAWAII” US EPA 402-R-93-031 Sept 1993 page IV-22. Kansas radon test results are from 2016, 2017, and 2019 as these were the only available years. Mississippi radon estimates are based on all Mississippi counties with summaries of results available at www.radon.com/maps.
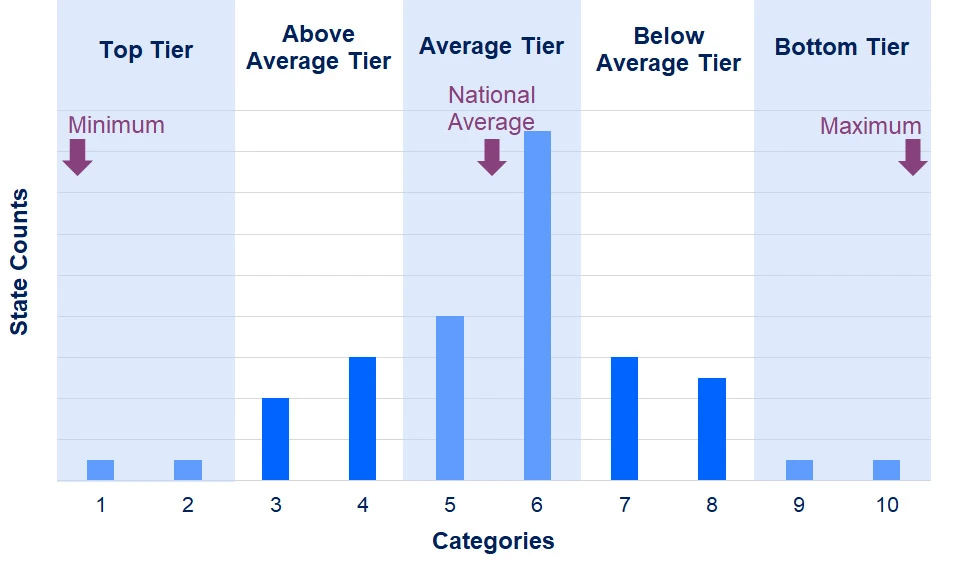
States were ranked from best to worst for each cancer-specific measure. In addition, statements describing the distance from the mean for each specific state measure were crafted to provide a clearer understanding of how each specific data point falls within the national data range, and how the state data differs from the national average.
Statements such as “above average tier” and “average tier,” were determined by dividing each measure (incidence, smoking, survival, early diagnosis, surgery, lack of treatment, and screening) into two sets of five contiguous ranges; one set ranging from the maximum observed value to the national average, and the other from the national average to the minimum observed value. Data values were described by which category they fell into:
- The two lowest categories were classified as “bottom tier;”
- data values that fell into the third and fourth lowest categories were classified as “below average tier;”
- data values that fell into the two middle categories were classified as “average tier;”
- data values that fell into the third and fourth highest categories were classified as “above average tier;” and
- data values that fell into the two highest categories were classified as “top tier”
Take Action
Email your governor and ask them to help end lung cancer by supporting insurance coverage of comprehensive biomarker testing.

Page last updated: February 5, 2026