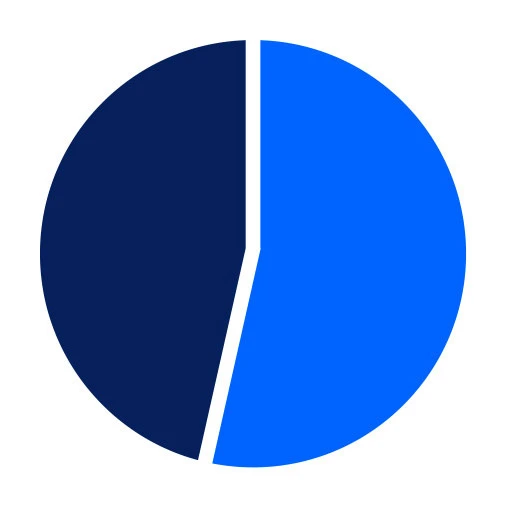
The “State of the Air” 2025 report finds that even after decades of successful efforts to reduce sources of air pollution, 46% of Americans—156.1 million people—are living in places that get failing grades for unhealthy levels of ozone or particle pollution. This is nearly 25 million more people breathing unhealthy air compared to last year’s report, and more than in any other “State of the Air” report in the last ten years.
Extreme heat, drought and wildfires are contributing to worsening levels of air pollution across much of the U.S., exposing a growing proportion of the population to ozone and particle pollution that put their health at risk.
The “State of the Air” report looks at two of the most widespread and dangerous air pollutants, fine particles and ozone. The air quality data used in the report are collected at official monitoring sites across the United States by federal, state, local and Tribal governments. The Lung Association calculates values reflecting the air pollution problem and assigns grades for daily and long-term measures of particle pollution and daily measures of ozone. Those values are also used to rank cities (metropolitan areas) and counties. This year’s report presents data from 2021, 2022 and 2023, the most recent three years of quality-assured nationwide air pollution data publicly available. See About This Report for more detail about the methodology for data collection and analysis.
“State of the Air” 2025 is the 26th edition of this annual report, which was first published in 2000. From the beginning, the findings in “State of the Air” have reflected the successes of the Clean Air Act, as emissions from transportation, power plants and manufacturing have been reduced over time. Over the last decade, however, the findings of the report have added to the extensive evidence that a changing climate is making it harder to protect this hard-fought progress on air quality and human health. Increases in high ozone days and spikes in particle pollution related to extreme heat, drought and wildfires are putting millions of people at risk and adding challenges to the work that states and cities are doing across the nation to clean up air pollution.
After several years of reporting that the worst of the nation’s air quality problems were increasingly concentrated in western states, “State of the Air” 2025 finds the geographic distribution of air pollution shifting back East. The year 2023, which is included in this year’s report for the first time, brought improved conditions to the west coast but also a deadly heat wave in Texas and an unprecedented blanket of smoke from wildfires in Canada that drove levels of ozone and particle pollution in dozens of central and eastern states higher than they have been in many years.
Again this year, “State of the Air” finds that the burden of living with unhealthy air is not shared equally. Research has shown that communities of color are disproportionately exposed to unhealthy air and are also more likely to be living with one or more chronic conditions that make them more vulnerable to air pollution, including asthma, diabetes and heart disease. Although people of color make up 41.2% of the overall population of the U.S., they are 50.2% of the people living in a county with at least one failing grade. Notably, Hispanic individuals are nearly three times as likely as white individuals to live in a community with three failing grades.
In “State of the Air” 2025, the metropolitan areas that ranked worst in the country for each of the three pollutant measures are unchanged from last year’s report. Bakersfield, California tops the list for worst short-term particle pollution for the third straight year. Bakersfield also continues to be the metropolitan area with the worst level of year-round particle pollution for the 6th year in a row. Los Angeles is the city with the worst ozone pollution in the nation, as it has been in 25 of the 26 years of reporting in “State of the Air”– although city residents are exposed to 77 fewer days each year, or two and a half months’ worth, with unhealthy levels of ozone, on average, than they were in 2000.
More Findings
-
State of the Air print report
Download


