Ozone air pollution is making breathing difficult for more people living in the U.S. than any other single pollutant. In the years 2021, 2022, and 2023, 37% of the population, some 125.2 million people, were exposed to levels of ozone that put their health at risk. This is an increase of 24.6 million people over last year’s figure, and includes tens of millions of infants and children, people age 65 or older and others whose conditions make them especially vulnerable to health harm from air pollution.
After several years of successful reductions in ozone pollution in many parts of the country thanks to clean-up measures enacted under the Clean Air Act, the results in “State of the Air” 2025 are a distressing reversal of that progress. The places that earned an “F” grade for ozone in this year’s report were spread across 211 counties in 35 states and Washington, D.C. Ninety-three more counties earned an “F” grade than in last year’s report, and 10 more states saw at least one of their counties added to the list. Many places that were considered untroubled by ozone smog in recent years of the report saw their air quality worsen, sometimes by quite a lot – 137 counties lost their A grade, including 10 that went from an A to an F.
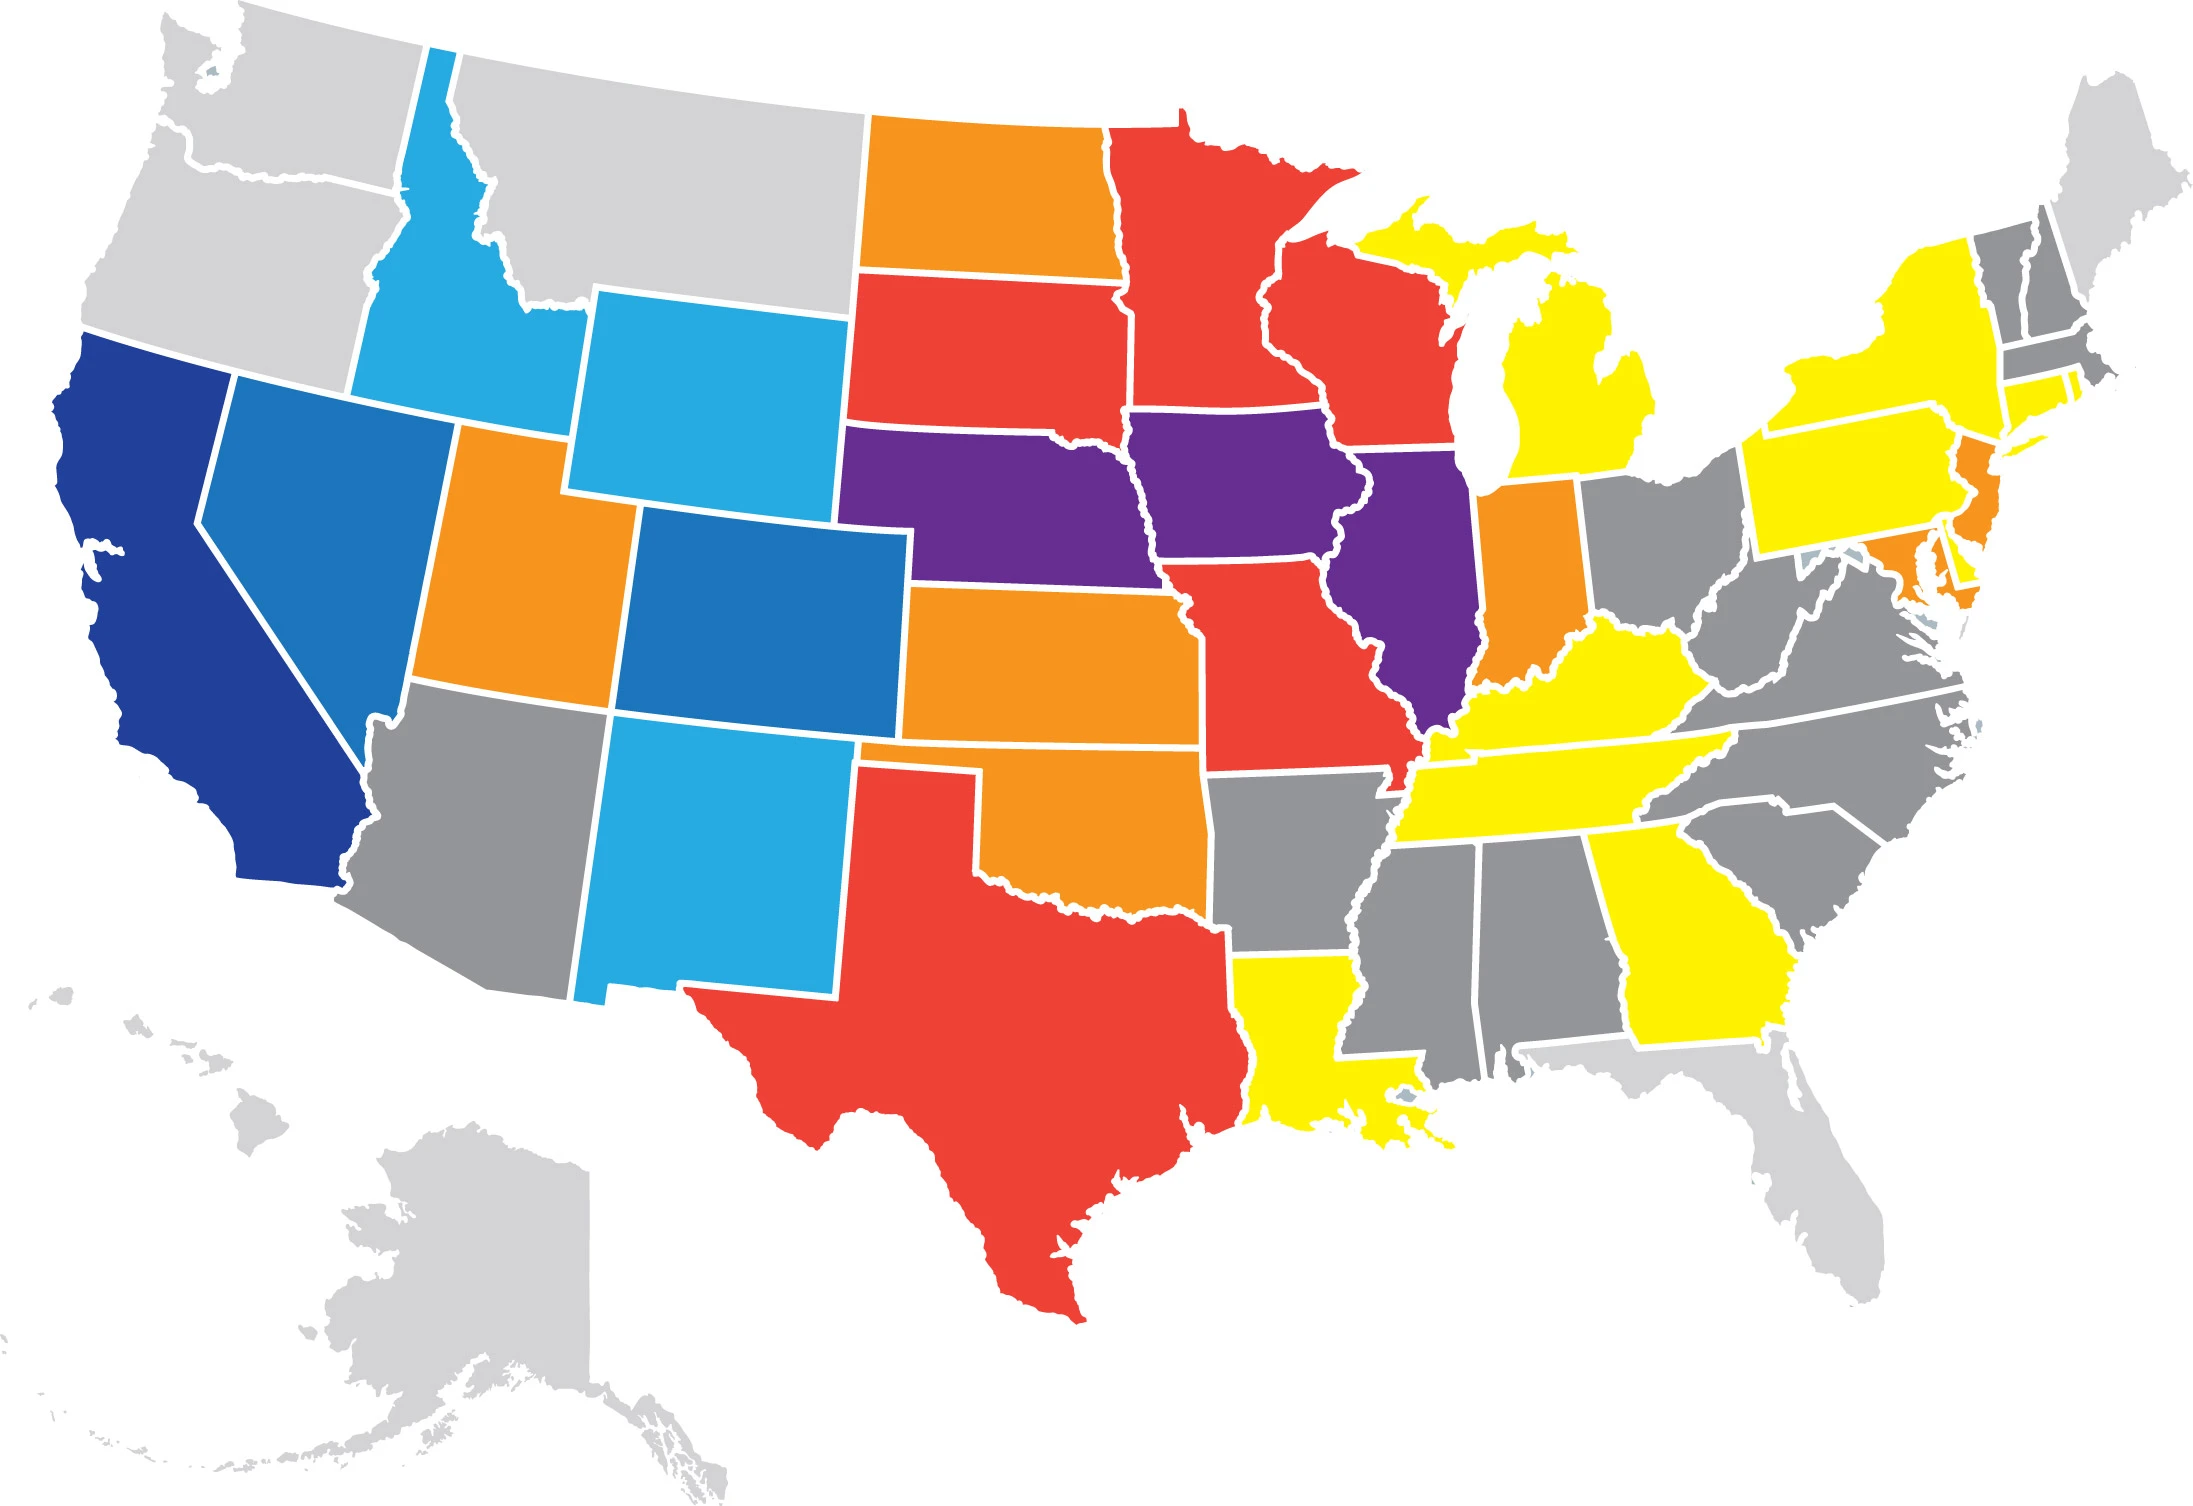
The severity of the problem and the abruptness of the change are unprecedented in magnitude. Nationwide, nearly five times as many counties’ ozone levels worsened as improved. Nine states saw the number of unhealthy days for ozone get worse in every one of their counties monitored for this pollutant, including all 27 monitored counties in Indiana, all 23 in Illinois, and all 17 in Missouri.
In spite of these startling results, it is worth pointing out that a handful of western states experienced something of a respite in this year’s report. More counties improved than worsened in California, Idaho, Nevada, New Mexico and Wyoming, even though ozone levels in many of their counties continued to be unhealthy on many days.
Despite the widespread worsening in parts of the country, the list of the Worst 25 cities for ozone pollution in “State of the Air” 2025 and their order of ranking remains relatively stable compared with last year’s report.
The largest changes in rank are for Tulsa, OK, worsening from 31st to 19th worst, and for St. Louis, MO, for 30th to 21st worst. Both were most recently on the Worst 25 list in the 2016 report. Sheboygan, WI is the only other city to join the list this year, having last appeared on the 2021 most polluted list. Those three new cities take the places of San Luis Obispo, CA and Reno, NV, which improved enough to move off the worst 25 list, and of Grand Rapids, MI, which worsened significantly, but not enough to remain on the list.
In one small piece of good news, none of the cities on the Worst 25 list reported a worst-ever average number of days of ozone smog. In fact, four cities, all in California – Fresno (for its second year in a row), Bakersfield, Sacramento, and Visalia – recorded their fewest-ever number of unhealthy days for ozone, though they all still earned “F” grades.
The geographical distribution of cities on the Worst 25 list repeats the pattern seen over the last decade – the highest levels of ozone air pollution continue to occur in the West. California retains its position of being the state with the most metro areas on the list with 9 of the 25 most-polluted cities. Arizona, Colorado, Nevada, New Mexico, Oklahoma, Texas and Utah account for 12 others. They are joined this year by four more easterly cities, Chicago, New York, St. Louis, and Sheboygan.
Although cleanup of ozone precursor pollutants from industrial, power generation, and mobile sources has been working to reduce ozone concentrations, the impact of climate change has resulted in widespread wildfire disasters and has also meant higher temperatures, dry, sunny skies and more frequent stagnation events. Taken together, these conditions produced much higher numbers of unhealthy ozone days than would otherwise be the case.


